Exercise 3: Testing Common Household Materials for pH Values
PROCEDURE:
1. Gather nine household liquid items to test, such as shampoo, soap, lemon juice, soda, milk, and cleaning supplies.
2. Record these items in a data table similar to Data Table 5.
Data Table 5 – pH observations
|
Container |
Item tested |
Homemade
pH strip |
Color |
pH |
1 |
Water |
|
|
2 |
|
|
|
3 |
|
|
|
4 |
|
|
|
5 |
|
|
|
6 |
|
|
|
7 |
|
|
|
8 |
|
|
|
9 |
|
|
|
10 |
|
|
|
3. Place the following item into the first well / container. (Container can even be a spoon -- there only needs to be about 4 - 5 drops of the liquid to test. If not using disposable spoon liquids should only be food grade.)
· Well #1: Fill halfway with Water.
NOTE: Use Data Table 5 to keep track of which samples are in which wells.
4. Put on safety glasses and gloves.
5. Using a separate pipet for each item, place each household liquid item that you have selected into its corresponding well or container, filling each well halfway. (You can perform this experiment one liquid at a time with rinsing the container out in between each liquid).
6. Wearing gloves, pick up one homemade pH strip. Holding the strip at one end, dip the bottom of the strip into Well / Container #1 to saturate the strip with the liquid in the well.
7. Observe the color of the strip and compare its color to the pH color range guide.
8. Record the color of the strip and its corresponding pH in Data Table 5.
9. Repeat Steps 6 through 8 for the remaining 9 wells /containers . Use a fresh strip of pH paper for each well.
10. A pH color guide for the homemade pH strips is shown in Figure 11.
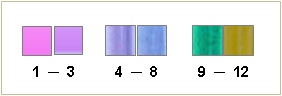
Figure 11 – Homemade pH strip color guide
11. When the experiment is complete, and all 10 wells / containers have been tested and the results have been recorded, discard all pH papers into the trash. Thoroughly clean, rinse, and dry all supplies.
12. When all materials are clean and dry, dispose of the glove in the trash and remove your safety goggles.
13. Review the results in Data Table 4. Using the homemade pH strip color guide, classify each substance as acidic, neutral, or basic and record these results in a table similar to Data Table 6. Additionally, write a short explanation of how you decided on each classification.
Data Table 6 — Analysis of results
| Well plate |
Item tested |
Acid/Base/Neutral? |
Explanation: |
1 |
Water |
|
|
2 |
|
|
|
3 |
|
|
|
4 |
|
|
|
5 |
|
|
|
6 |
|
|
|
7 |
|
|
|
8 |
|
|
|
9 |
|
|
|
10 |
|
|
|
|