Experiment 1B: Free Fall
PURPOSE: Measure the acceleration due to gravity.
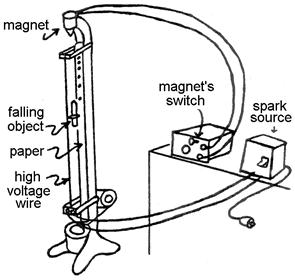
APPARATUS: An object suspended from an electromagnet falls when
the magnet is turned off. There is a wire on each side of it as it falls. Every sixtieth of a second, a high voltage
pulse is sent to one wire, making a spark jump to a metal ring on the falling
object and from there to the other wire.
The spark marks heat sensitive paper covering this second wire,
periodically recording the object’s position.
CAUTIONS:
Do
not use the apparatus without someone else in the room to pull the plug if you
are being shocked.
The spark source's red lead should go to the free
fall device's high voltage wire. The black
(ground) lead goes to the connector at the right. Do not mix them up.
Do not move the apparatus or you may throw it out of
level, making the object land improperly.
PROCEDURE.
1. When your group's turn comes, run off a tape:
a. Turn on
the electromagnet with the key on its power supply.
b. Suspend
the object from the electromagnet and steady it so that it hangs motionless.
c. Turn on
the switch on the face of the spark source, which should be set for 60 Hz. Pick up the hand pushbutton and hold it down
to turn on the sparks.
d. Switch
off the power supply to drop the object.
When it lands, take your thumb off the button and turn off the switch on
the face of the spark source.
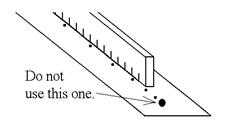
2. Lay your group’s tape on your table. Do not use the large first dot. Number the next fifteen dots after that. Time,
in the answer sheet’s first column, is the dot number over 60 because there
were 60 sparks per second. Stop when the table is full; there are more
dots than you need.
Each
interval should be just a little larger than the one before. If a dot is missing, ask what to do.
 3. Put a meter stick on its edge
so that its markings are right next to the dots. Record where the dots are. (Their position on an x axis along the tape,
not the distance from the previous dot.)
Magnifying glasses are available.
Do not throw out the tape until you are told nothing needs rechecking.
3. Put a meter stick on its edge
so that its markings are right next to the dots. Record where the dots are. (Their position on an x axis along the tape,
not the distance from the previous dot.)
Magnifying glasses are available.
Do not throw out the tape until you are told nothing needs rechecking.
4. In the third column, leave the first line
blank because there is no line above it to subtract from. Also leave the last line blank because it has
no line below it. On the rest, calculate
Δx for the 2/60 second centered on that line’s
dot. That is, Δx
from the dot on the line above to the dot on the line below. Imitate this example:
|
Time, t (sec) |
Position, x (cm) |
Δx from dot before this one to
dot after it (Δt
= 1/30 s) Δx (cm) |
Velocity, v = Δx/Δt (cm/s) |
|
0 |
0.00 |
– |
– |
|
1/60 |
0.95 |
2.55 |
76.5 |
|
2/60 |
2.55 |
3.85 |
115.5 |
|
3/60 |
4.80 |
– |
– |
5.
Calculate the speed at each dot, except the first and last, using the Δx and Δt centered on that dot. (The average speed over a
time interval equals the instantaneous speed at the midpoint of that
interval.) Don't round off excessively, or
your answer’s accuracy will suffer. Keep in mind that dividing by 1/30 is the same as multiplying
by 30. Try punching up the numbers in
the example to be sure you see what to do.
6. Plot a graph of velocity
versus time. Observe these rules, as you
should with any graph:
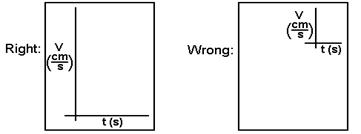
- Time goes on the horizontal axis.
- Pick a scale
which makes the graph pretty much fill the page (without going off the
edge.) A larger scale is more accurate.
- Label both
axes with the variable plotted along each and the unit each is measured
in.
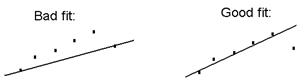
6. Draw what appears to be a best fit line through your
data: One that passes as close as
possible to as many points as possible.
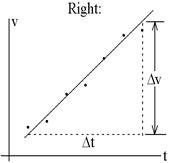
7. Find the slope of your graph to obtain the object’s
acceleration. Observe the following
rules which, again, also apply to all future labs:
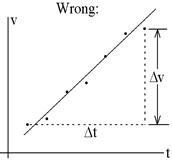
- Find it from the best fit
line, as in the picture on the left, not from points which lie off the line as
in the middle. (The line averages out some of the random
errors in individual points.)
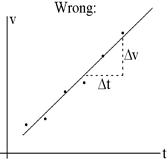
- Find it
from points near opposite ends of the line, not points near each other as on
the right. (If small numbers are off a
little, it makes more difference than if big numbers are off a little.)
Conclusion: The acceleration has an uncertainty of about
3%. Within this uncertainty, does your value
for g agree with the accepted one?
PHY 121 Experiment 1B – Free Fall
DATA
TABLE:
|
Time, t
(sec) |
Position, x (cm) |
Δx from dot before this one to
dot after it (Δt = 1/30 s) Δx (cm) |
Velocity, vx =Δx/Δt (cm/s) |
|
|
|
– |
– |
|
|
|
|
|
|
|
|
|
|
|
|
|
|
|
|
|
|
|
|
|
|
|
|
|
|
|
|
|
|
|
|
|
|
|
|
|
|
|
|
|
|
|
|
|
|
|
|
|
|
|
|
|
|
|
|
|
|
|
|
|
|
|
|
|
|
|
|
– |
– |
Attach graph, calculate g below or on back. Accepted value = ______________.